
Music Theory / Project
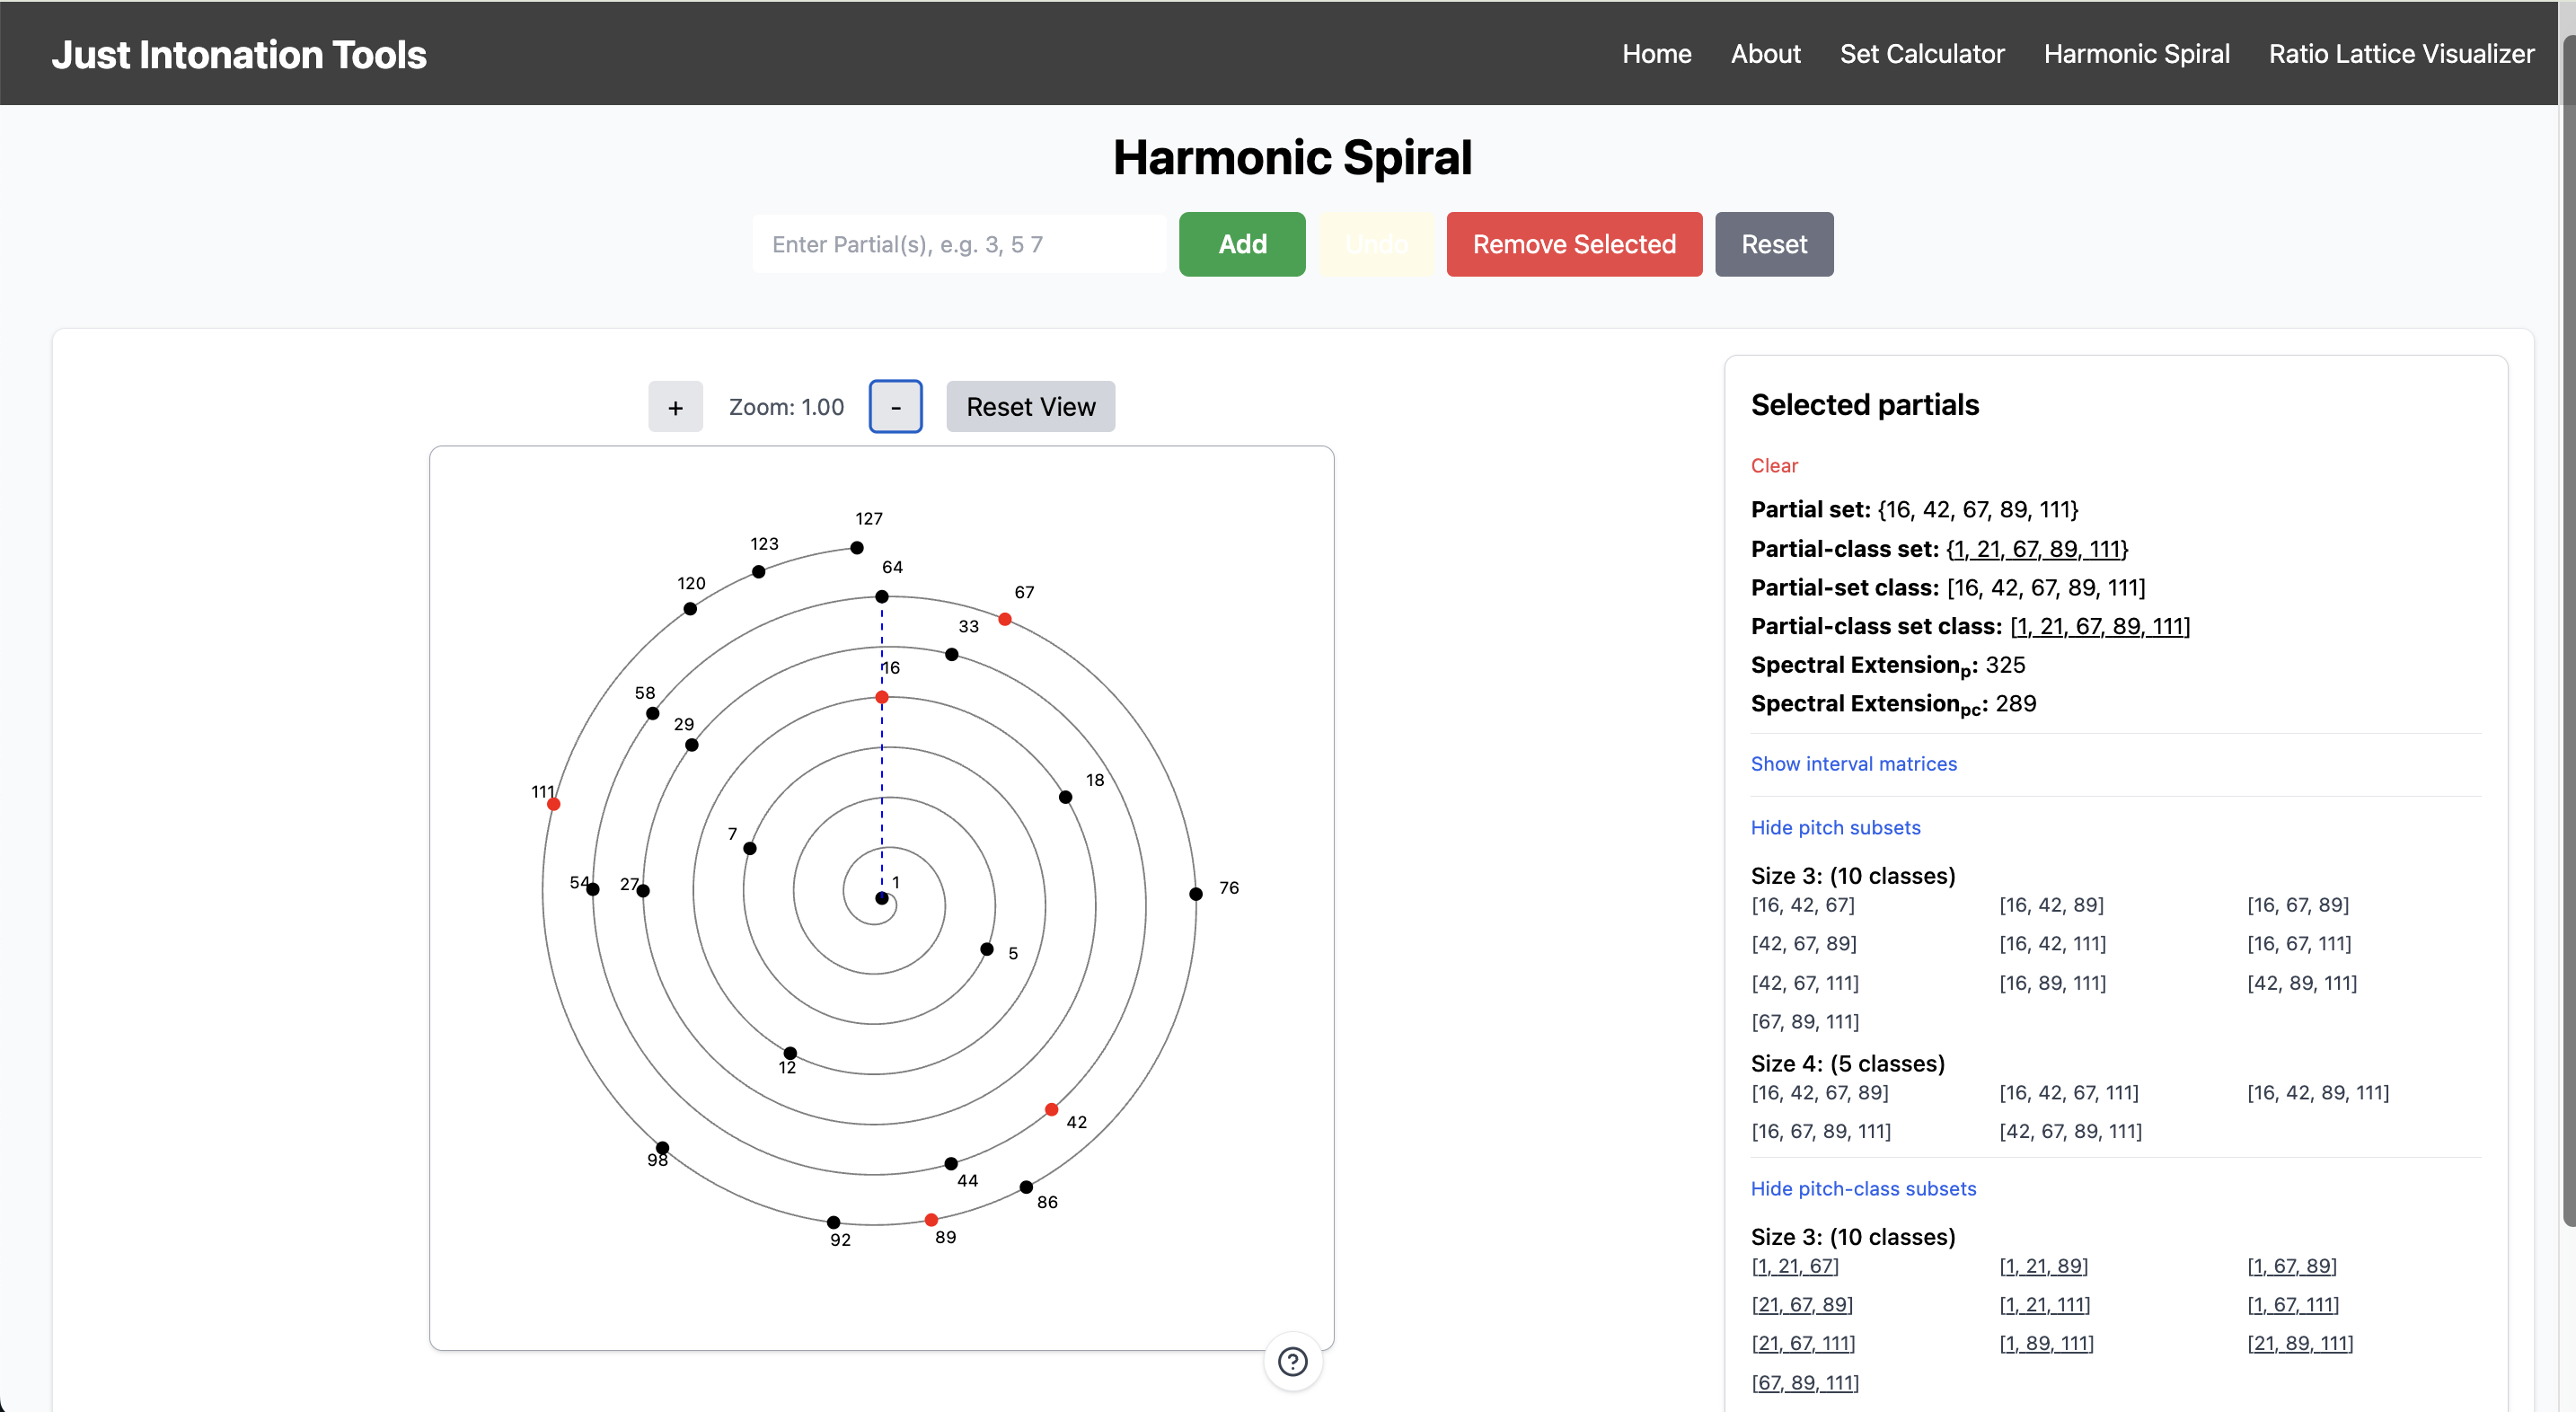
Harmonic Spiral Visualizer
An interactive spiral diagram for exploring the harmonic series and intervals and sets in just intonation.
Overview
A React and SVG visualization tool for plotting musical ratios on a logarithmic spiral. The tool grew out of my academic work on just intonation, harmonic complexity, and the representation of pitch relationships in continuous harmonic space.
Role
Designer and developer responsible for the interface, ratio parsing, SVG rendering, interaction logic, keyboard controls, and explanatory framing.
Context
Just intonation represents intervals as frequency ratios rather than as fixed positions in twelve-tone equal temperament. The harmonic spiral gives those ratios a visual form, making octave equivalence, generator relationships, and distance from simple ratios easier to see.
Problem
Many tuning relationships are difficult to understand from numbers alone. A ratio such as 81/64 or 45/32 contains useful theoretical information, but that information can be easier to compare when ratios can be plotted, selected, grouped, and viewed against a consistent spatial model.
Outcome
The project provides a hands-on way to explore just-intonation ratios, compare intervallic relationships, and test visual models of harmonic space.
Approach
- 01 Built a React interface for entering individual ratios and plotting larger batches of ratios.
- 02 Rendered the visualization with SVG so ratio points, labels, guide lines, and selected states could update directly from application state.
- 03 Mapped ratios onto a logarithmic spiral to show octave-related positions and continuous pitch relationships.
- 04 Added generator rays, octave lines, point selection, and keyboard-driven controls for moving through the diagram.
- 05 Designed the tool as an exploratory companion to research on just intonation, harmonic space, and harmonic complexity.